- 1. Overview
- 2. Data Set Summary & Exploration
- 3. Design and Test a Model Architecture
- 4. Test a Model on New Images
1. Overview
In this project, I have implemented a classifier using deep neural networks, convolutional neural networks and transfer learning to classify traffic signs. I have trained a model so that it can decode traffic signs from natural images by using the German Traffic Sign Dataset. After the model is trained, I have tested my model program on new images of traffic signs collected from the web.
The steps of this project are the following:
- Load the data set (see below for links to the project data set)
- Explore, summarize and visualize the data set
- Design, train and test a model architecture
- Use the model to make predictions on new images
- Analyze the softmax probabilities of the new images
- Summarize the results with a written report
2. Data Set Summary & Exploration
This is a pickled dataset in which we’ve already resized the images to 32x32.
Provide a basic summary of the data set
I used the numpy library to calculate summary statistics of the traffic signs data set:
- The size of training set is 34799
- The size of validation set is 4410
- The size of test set is 12630
- The shape of a traffic sign image is (32, 32, 3)
- The number of unique classes/labels in the data set is 43
Include an exploratory visualization of the dataset
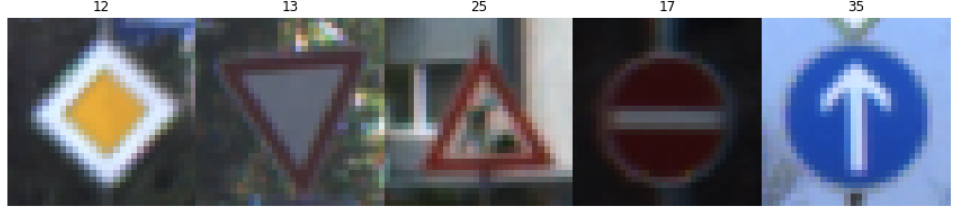
Here is an exploratory visualization of the data set. It pulls in a random set of 5 images.
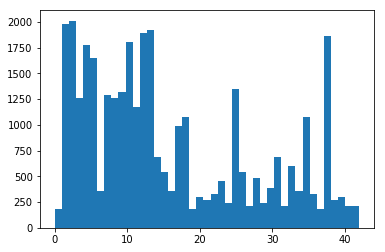
I also detail the dataset structure by plotting the occurrence of each image class to get an idea of how the data is distributed.
3. Design and Test a Model Architecture
My final model consisted of the following layers:
| Layer | Description |
|---|---|
| Input | 32x32x3 RGB image |
| Convolution 5x5 | 2x2 stride, valid padding, outputs 28x28x6 |
| RELU | |
| Max pooling | 2x2 stride, outputs 14x14x6 |
| Convolution 5x5 | 2x2 stride, valid padding, outputs 10x10x16 |
| RELU | |
| Max pooling | 2x2 stride, outputs 5x5x6 |
| Fully connected | input 400, output 120 |
| RELU | |
| Dropout | 50% keep |
| Fully connected | input 120, output 84 |
| RELU | |
| Dropout | 50% keep |
| Fully connected | input 84, output 43 |
To train the model, I used an LeNet for the most part that was given, but I added a dropout function for deleteing the fully connected layer’s output. I used the AdamOptimizer with a learning rate of 0.001. The epochs used was 30 while the batch size was 64. Other important parameters I learned were important was the number and distribution of additional data generated.
My final model results were:
- Train Accuracy = 0.999
- Valid Accuracy = 0.968
- Test Accuracy = 0.946
4. Test a Model on New Images
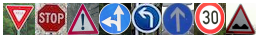
Here are five German traffic signs that I found on the web:
The model was able to correctly guess 8 of the 8 traffic signs, which gives an accuracy of 100%.
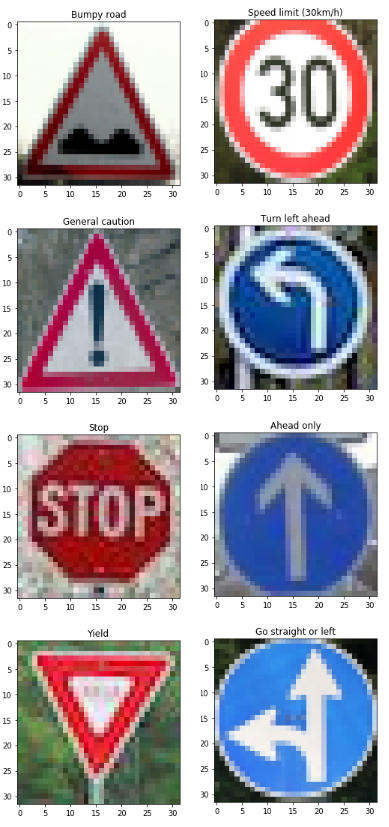
For the first image, the model is relatively sure that this is a Bumpy road (probability of 0.996), and the image does contain a bumpy road. The top 3 soft max probabilities were:
| Probability | Prediction |
|---|---|
| 0.9967528 | Bumpy Road |
| 0.0015 | Bicycles crossing |
| 0.0013 | Traffic signals |