- 0. 小结
- 2. Lesson Introduction
- 3. Plotting Robot Motion (right angles only)
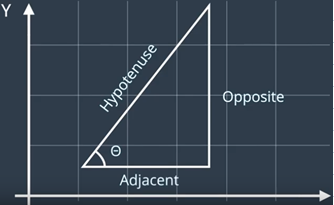
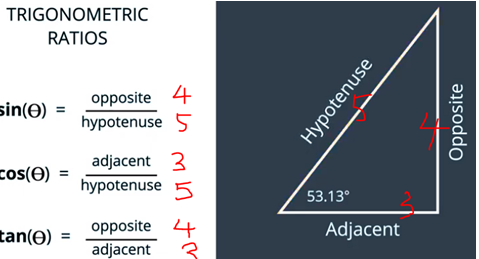
- 9. Opposite(对边), Adjacent(邻边), Hypotenuse(斜边)
- 11. Looking up Sin, Cos, and Tan
- 15. Keeping Track of x and y
0. 小结
本章算是比较简单,介绍了三角函数的一些知识和在python中的应用。
2. Lesson Introduction
在这个实战项目中,你需要使用加速计,速率陀螺仪,和里程表的数据,重新构造无人驾驶车的实际XY轨迹。
上面的卡尔曼滤波中,学习了如何将加速度数据转换为位移数据,以及如何使用速率陀螺仪计算方向。
但是,当你知道一辆车朝向某个方向,并且知道它的移动距离后,如何计算它在X和Y的方向的准确移动距离呢。
本章的内容就是,如何根据方向和位移来确定X和Y方向的位置变化
3. Plotting Robot Motion (right angles only)
示例代码:完成drive_forward和turn_right:
from matplotlib import pyplot as plt

class Vehicle:
    def __init__(self):
        """
        Creates new vehicle at (0,0) with a heading pointed East.
        """
        self.x       = 0 # meters
        self.y       = 0
        self.heading = "E" # Can be "N", "S", "E", or "W"
        self.history = []

    # TODO-1 - Implement this function
    def drive_forward(self, displacement):
        """
        Updates x and y coordinates of vehicle based on
        heading and appends previous (x,y) position to
        history.
        """

        # this line appends the current (x,y) coordinates
        # to the vehicle's history. Useful for plotting
        # the vehicle's trajectory. You shouldn't need to
        # change this line.
        self.history.append((self.x, self.y))

        # vehicle currently pointing east...
        if   self.heading == "E":
            self.x += displacement

        # north
        elif self.heading == "N":
            self.y += displacement

        # west
        elif self.heading == "W":
             self.x -= displacement

        # south
        else:
             self.y -= displacement

    def turn(self, direction):
        if direction == "L":
            self.turn_left()
        elif direction == "R":
            self.turn_right()
        else:
            print("Error. Direction must be 'L' or 'R'")
            return

    def turn_left(self):
        """
        Updates heading (for a left turn) based on current heading
        """
        next_heading = {
            "N" : "W",
            "W" : "S",
            "S" : "E",
            "E" : "N",
        }
        self.heading = next_heading[self.heading]


    # TODO-2 - implement this function
    def turn_right(self):
        """
        Updates heading (for a left turn) based on current heading
        """
        next_heading = {
            "N" : "E",
            "W" : "N",
            "S" : "W",
            "E" : "S",
        }
        self.heading = next_heading[self.heading]

    def show_trajectory(self):
        """
        Creates a scatter plot of vehicle's trajectory.
        """
        X = [p[0] for p in self.history]
        Y = [p[1] for p in self.history]

        X.append(self.x)
        Y.append(self.y)

        plt.scatter(X,Y)
        plt.plot(X,Y)
        plt.show()
# TESTING CODE 1
# instantiate vehicle
v = Vehicle()
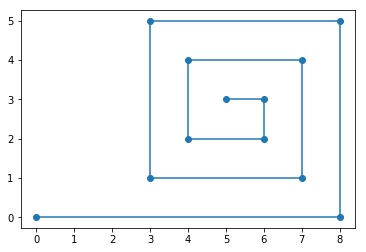
# drive in spirals of decreasing size
v.drive_forward(8)
v.turn("L")
v.drive_forward(5)
v.turn("L")
v.drive_forward(5)
v.turn("L")
v.drive_forward(4)
v.turn("L")
v.drive_forward(4)
v.turn("L")
v.drive_forward(3)
v.turn("L")
v.drive_forward(3)
v.turn("L")
v.drive_forward(2)
v.turn("L")
v.drive_forward(2)
v.turn("L")
v.drive_forward(1)
v.turn("L")
v.drive_forward(1)
# show the trajectory. It should look like a spiral
v.show_trajectory()
# TESTING
assert(v.x == 5)
assert(v.y == 3)
first_5 = [
(0, 0),
(8, 0),
(8, 5),
(3, 5),
(3, 1)
]
assert(first_5 == v.history[:5])
print("Nice job! Your vehicle is behaving as expected!")
输出:
Nice job! Your vehicle is behaving as expected!
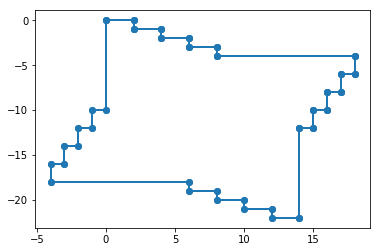
# TESTING CODE Part 2
def test_zig_zag():
    v = Vehicle()
    for i in range(10):
        for _ in range(4):
            v.drive_forward(2)
            v.turn("R")
            v.drive_forward(1)
            v.turn("L")
        v.drive_forward(10)
        v.turn("R")
    first_six = [
        (0,0),
        (2,0),
        (2,-1),
        (4,-1),
        (4,-2),
        (6,-2)
    ]
    v.show_trajectory()
    assert(v.x == 14)
    assert(v.y == -22)
    assert(v.history[:6] == first_six)
    print("Nice job! Your vehicle passed the zig zag test.")
test_zig_zag()
输出:
Nice job! Your vehicle passed the zig zag test.
9. Opposite(对边), Adjacent(邻边), Hypotenuse(斜边)
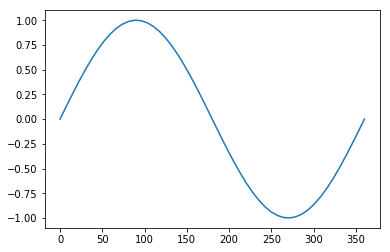
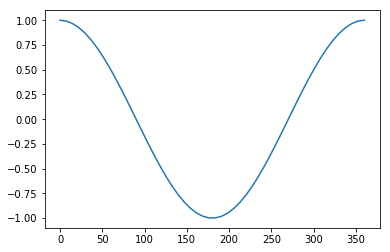
11. Looking up Sin, Cos, and Tan
from math import pi
def deg2rad(theta):
    """Converts degrees to radians"""
    # TODO - implement this function (solution
    #    code at end of notebook)

    return theta*(pi/180)

assert(deg2rad(45.0) == pi / 4)
assert(deg2rad(90.0) == pi / 2)
print("Nice work! Your degrees to radians function works!")

for theta in [0, 30, 45, 60, 90]:
    theta_rad = deg2rad(theta)
    sin_theta = sin(theta_rad)
    print("sin(", theta, "degrees) =", sin_theta)
Nice work! Your degrees to radians function works!
sin( 0 degrees) = 0.0
sin( 30 degrees) = 0.49999999999999994
sin( 45 degrees) = 0.7071067811865475
sin( 60 degrees) = 0.8660254037844386
sin( 90 degrees) = 1.0
import numpy as np
from matplotlib import pyplot as plt
def plot_sine(min_theta, max_theta):
    """
    Generates a plot of sin(theta) between min_theta
    and max_theta (both of which are specified in degrees).
    """
    angles_degrees = np.linspace(min_theta, max_theta)
    angles_radians = deg2rad(angles_degrees)
    values = np.sin(angles_radians)
    X = angles_degrees
    Y = values
    plt.plot(X,Y)
    plt.show()

# EXERCISE 2.1 Implement this! Try not to look at the
#  implementation of plot_sine TOO much...
def plot_cosine(min_theta, max_theta):
    """
    Generates a plot of sin(theta) between min_theta
    and max_theta (both of which are specified in degrees).
    """
    angles_degrees = np.linspace(min_theta, max_theta)
    angles_radians = deg2rad(angles_degrees)
    values = np.cos(angles_radians)
    X = angles_degrees
    Y = values
    plt.plot(X,Y)
    plt.show()
plot_sine(0, 360)
plot_cosine(0, 360)
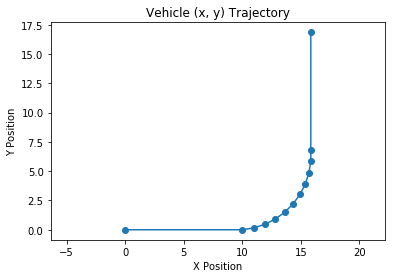
15. Keeping Track of x and y
下面的代码,根据位移和转向,描画出运动轨迹:
import numpy as np
from math import pi
from matplotlib import pyplot as plt

# these 2 lines just hide some warning messages.
import warnings
warnings.filterwarnings('ignore')

class Vehicle:
    def __init__(self):
        self.x       = 0.0 # meters
        self.y       = 0.0
        self.heading = 0.0 # radians
        self.history = []

    def drive_forward(self, displacement):
        """
        Updates x and y coordinates of vehicle based on
        heading and appends previous (x,y) position to
        history.
        """
        delta_x = displacement * np.cos(self.heading)
        delta_y = displacement * np.sin(self.heading)

        new_x = self.x + delta_x
        new_y = self.y + delta_y

        self.history.append((self.x, self.y))

        self.x = new_x
        self.y = new_y

    def set_heading(self, heading_in_degrees):
        """
        Set's the current heading (in radians) to a new value
        based on heading_in_degrees. Vehicle heading is always
        between -pi and pi.
        """
        assert(-180 <= heading_in_degrees <= 180)
        rads = (heading_in_degrees * pi / 180) % (2*pi)
        self.heading = rads

    def turn(self, degrees):
        rads = (degrees * pi / 180)
        new_head = self.heading + rads % (2*pi)
        self.heading = new_head

    def show_trajectory(self):
        """
        Creates a scatter plot of vehicle's trajectory.
        """
        # get the x and y coordinates from vehicle's history
        X = [p[0] for p in self.history]
        Y = [p[1] for p in self.history]

        # don't forget to add the CURRENT x and y
        X.append(self.x)
        Y.append(self.y)

        # create scatter AND plot (to connect the dots)
        plt.scatter(X,Y)
        plt.plot(X,Y)

        plt.title("Vehicle (x, y) Trajectory")
        plt.xlabel("X Position")
        plt.ylabel("Y Position")
        plt.axes().set_aspect('equal', 'datalim')
        plt.show()
# Use this testing code to check your code for correctness.
from testing import test_drive_forward, test_set_heading

test_set_heading(Vehicle)
test_drive_forward(Vehicle)
# instantiate vehicle
v = Vehicle()

# drive forward 10 meters
v.drive_forward(10)

# turn left in 10 increments of 9 degrees each.
for _ in range(10):
    v.turn(9.0)
    v.drive_forward(1)

v.drive_forward(10)

v.show_trajectory()